Debugging Bluetooth Low Energy (BLE) devices can feel like a black box without the right tools. In this article, you’ll learn what BLE sniffers are, when to use them, and how to choose between entry-level and advanced options based on your debugging needs. Whether you’re troubleshooting connection issues or analyzing complex packet flows, understanding the role of Bluetooth analyzers can help you pinpoint problems faster and build more reliable connected products.
Understanding Bluetooth Analyzers and Their Importance
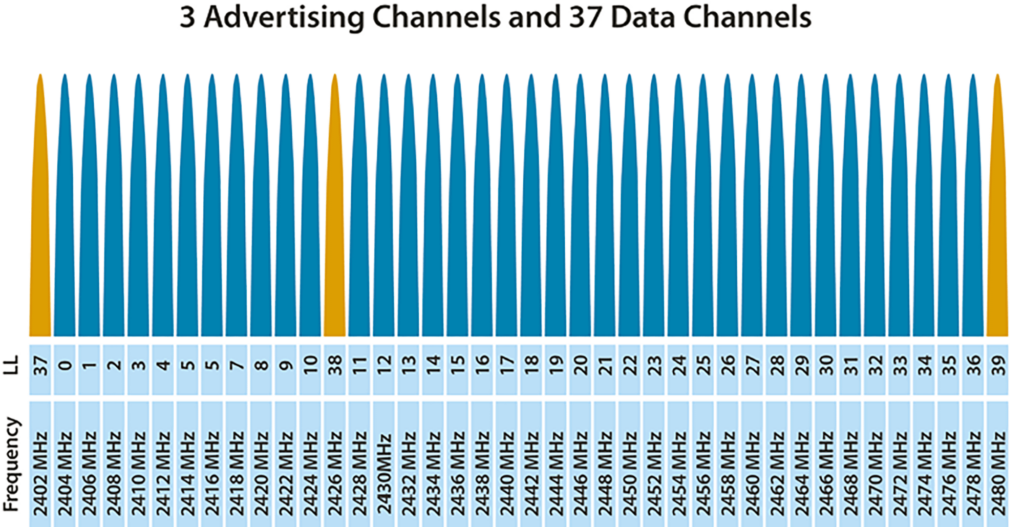
Bluetooth protocol analyzers, also known as Bluetooth sniffers, are devices that capture and inspect radio transmissions on frequencies defined by Bluetooth specifications. Bluetooth Low Energy (BLE), in particular, broadcasts advertisements on 3 specified frequencies or channels while also utilizing 37 other channels to send data between already connected devices. Because BLE payload data units (PDUs) vary in structure and content for different interactions across the 40 channels, mismatches in communication between devices can occur with little evidence of where the failure lies in the communication chain. Bluetooth analyzers act like an invisible 3rd party observer and “sniff” when devices transmit by detecting packets and filtering them by their characteristics and time of transmission.
In other words, analyzers give users the ability to identify and inspect the otherwise invisible transactions that may be causing their device’s operation to error out with little to no ability to trace the root cause in the firmware or Bluetooth layers. With this in mind, you can imagine how a tool like this could save hours of hair pulling and head scratching while hunting for a bug that stops your product from performing even the most basic functions. The list below defines some of the more common problems that may call for the use of analyzers with BLE devices.
Common points of failure in BLE communication:
| incorrectly defined advertising flags | appropriate central/peripheral designation | lost or poor throughput |
| Bluetooth classic vs BLE setup | Android/IOS service discovery | failure to pair, bond, connect, or disconnect |
So the next time you run into a problem while developing with BLE, you just need to get an analyzer, right?
Well, like most things in life, there are many different options to choose from, with a varying range of capabilities across different analyzers. A common starting point for most may be inspecting troublesome devices with a BLE phone tool like our LightBlue app (a basic analyzer in addition to a BLE actor). If LightBlue is not providing the level of detail and analysis that is required to troubleshoot, then knowing what other analyzer features exist will help prepare you for when you need to find out what your BLE packets actually look like.
Comparing BLE Sniffer Tools: Features and Options
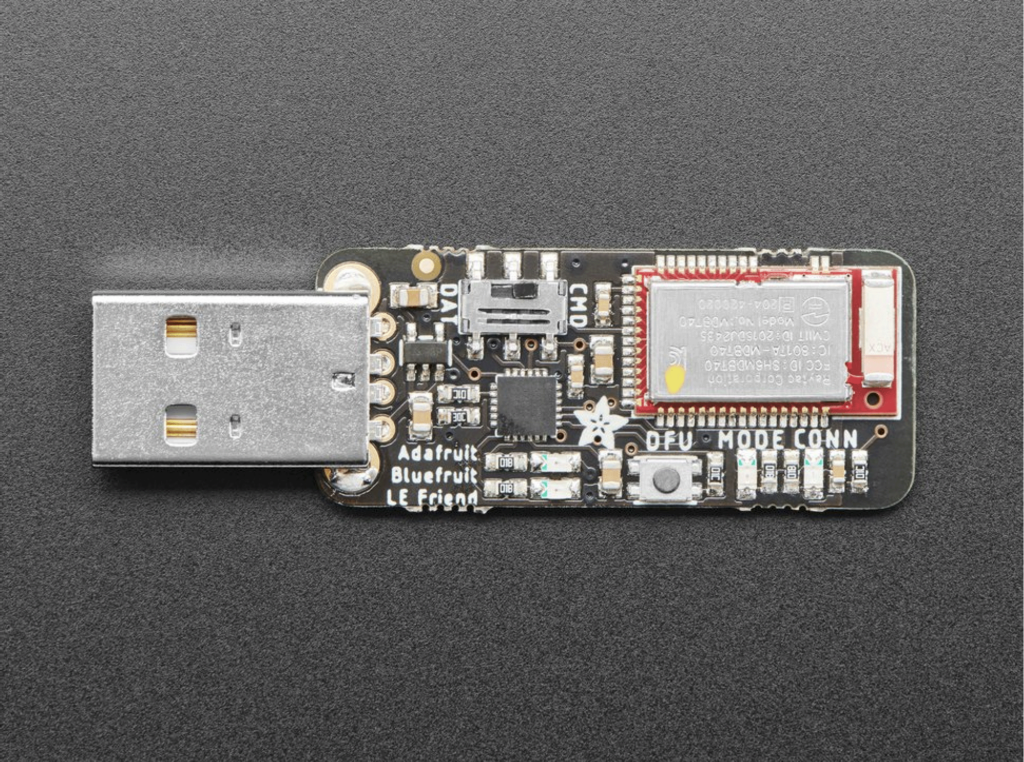
More common and lower entry analyzers utilize development boards or less expensive hardware platforms to provide packet sniffing abilities. Popular options like this include nRF Sniffer for BLE, Ubertooth One, and Adafruit’s Bluefruit LE Sniffer.
All of the options mentioned above utilize the versatile, open source network analyzer desktop software Wireshark to display and decode captured packets. Wireshark takes the data and displays it in a human readable format with standard information like a time of capture, device address, protocol, and packet type.
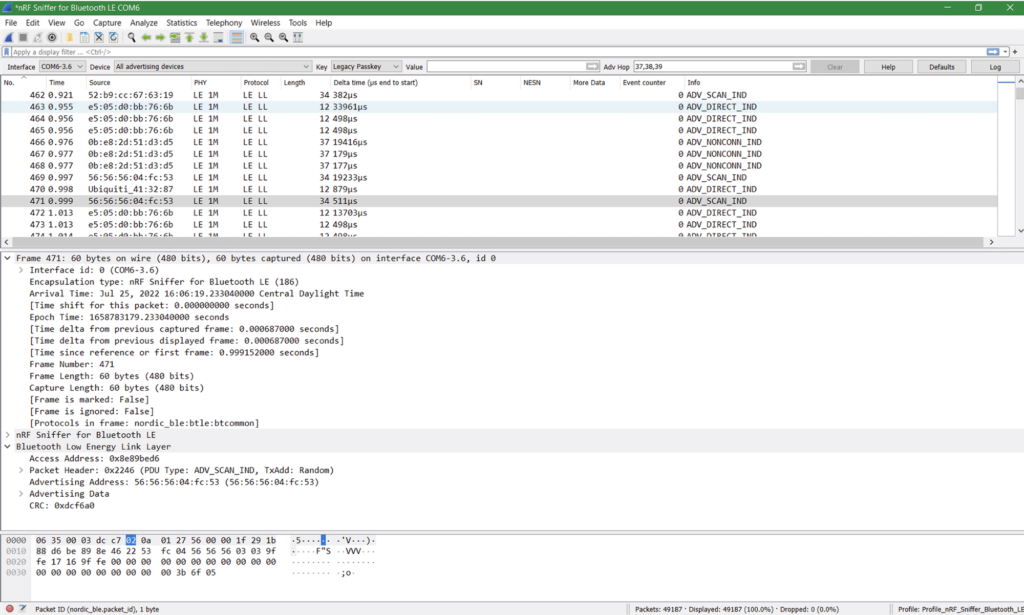
The standard Wireshark view presents a lot of information and helps get users out of the dark when it comes to seeing wireless transmissions. At the base level, we can see specific devices are sending out packets with some product-meaningful data like Addressing Data. This can be useful for walking through scanning/advertising and the connecting process between two devices. Using a lower-cost analyzer with Wireshark can be a great starting point for learning about BLE and uncovering initial bugs.
Due to the complex configurations with BLE that arise from multichannel, central-peripheral, and client-server roles, a deeper analysis of the BLE transmission may be necessary to uncover the whole interaction. Because the BLE traffic could occur on many different channels, basic analyzers may miss transmission. They lack the ability to sniff all transmissions that can occur on multiple channels simultaneously. As a result, higher end analyzers can be much more useful to capture all channel activity through their wide band radios. Higher end analyzers typically also have user-friendly software features that help developers traverse and filter through frames and time of transmission efficiently.
Effective Debugging Techniques Using Bluetooth Analyzers
Both low and high end analyzers have many more features and functions than this blog post will cover. For the sake of brevity, we’ll explore two use cases that demonstrate the abilities of an entry level analyzer and then touch on additional capabilities of higher end analyzers.
Using the nRF Sniffer for Basic Debugging
To showcase an entry point analyzer, let’s take a look at the nRF Sniffer’s capture of the pairing process between two devices. If you have an nRF Sniffer handy, feel free to follow along.
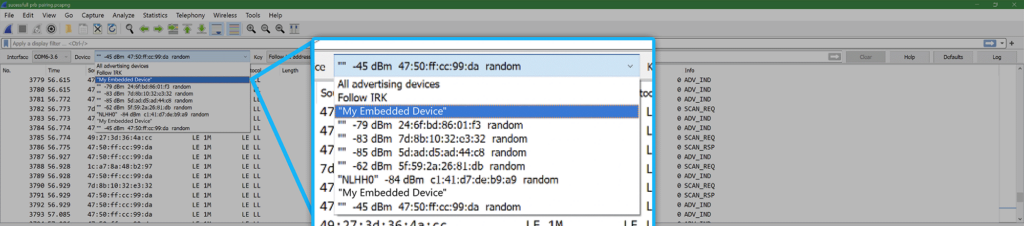
Once the nRF sniffer is running and sending data to Wireshark, we can start the process of finding our BLE device through the Device drop down menu. In the case where you have a lot of devices nearby, you can also use this tool to filter by RSSI before you start the capture. In our case, we set up the nRF sniffer using the Nordic documentation before selecting My Embedded Device as our device to inspect.
BTW there are a lot of great guides out there for setting up and using entry point analyzers like the nRF Sniffer for BLE, Ubertooth One, and Adafruit’s Bluefruit LE Sniffer.
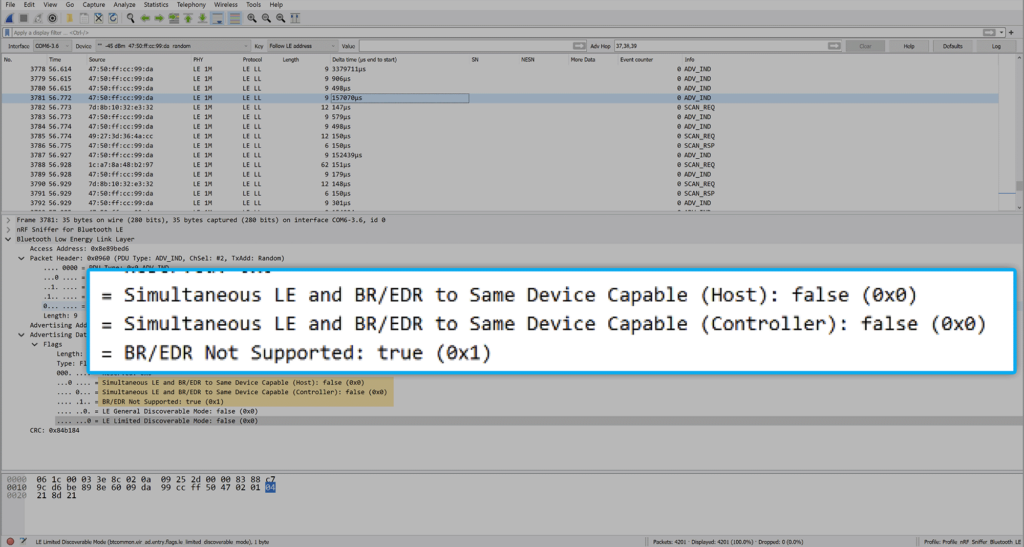
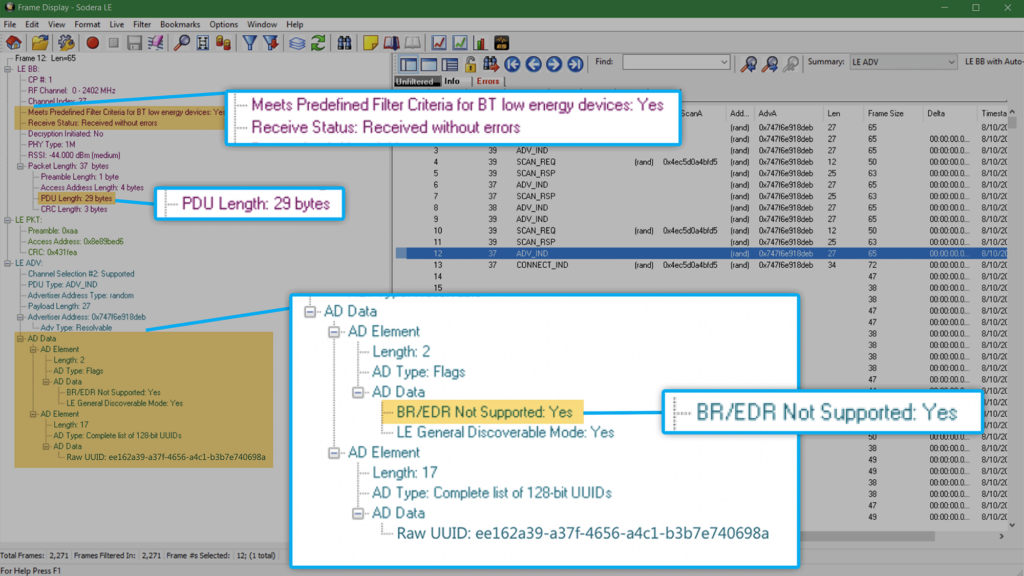
Right away you can see in the image below that the device is sending out packets before we have even initiated the pairing process. Each line represents a different frame capture that contains Bluetooth layer packets within. The Info column of Wireshark is useful here for starting the debugging process and understanding what the device is sending out. By selecting an ADV_IND frame, we can inspect the contents of this advertisement indication and see information the device is broadcasting about itself such as BR/EDR (Bluetooth Classic) and LE support.
Upon initiating the pairing with My Embedded Device and an Android phone running a development test app, we can see the captured frames become more interesting as Wireshark has identified a pairing dynamic between the two devices as they walk through the pairing process. Stepping through the packets in Wireshark now shows decoded Link Layer Data, L2CAP, Attribute, and Security Manager Protocol information contained within the subsequent packets.
These frames give us the information we need to check that the appropriate settings are defined in advertising, connecting requests, and following data exchanges. It’s usually helpful to inspect settings like supported PHY, supported BR/EDR/LE, bonding flags, defined GATT services and cross reference the found settings against your implementation, requirements, or the BLE specification to help uncover undesired properties that need to be addressed.
Wireshark also has functions that allow you to search for a specific packet, step through packets, and color code packets based on user set rules. Each bug may require a different type of troubleshooting process to come to a resolution, but the basic functions can provide a lead to follow towards the root cause. Analyzers unblock BLE development regardless if the problem lies in advertising, connecting, disconnecting, or sending data.
Capturing Advanced BLE Traffic with Sodera LE
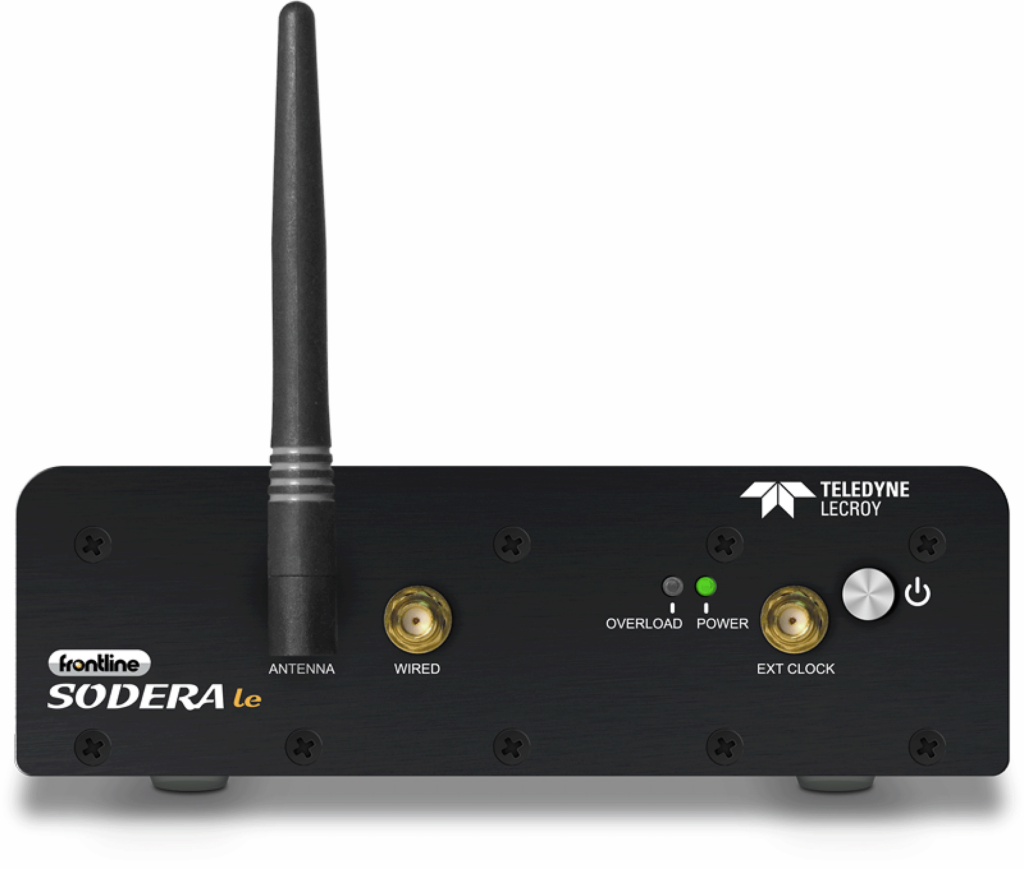
To build on top of already discussed analyzer functions, we’ll move on to our second use case where we inspect the pairing process between two BLE devices and then highlight more specialized features that come with a high-end analyzer. The analyzer of choice for this blog post is the Teledyne Lecroy Frontline Sodera LE Bluetooth Protocol Analyzer. There are other options for analyzers from companies like Ellisys and Teledyne Lecroy that support a variety of Bluetooth debugging features. In our case, the Sodera LE comes with Frontline software under the name ComProbe Protocol Analysis System, abbreviated as CPAS. CPAS is the Sodera LE’s equivalent to Wireshark, with base functionality to select and filter devices in addition to more tools that we will discuss later.
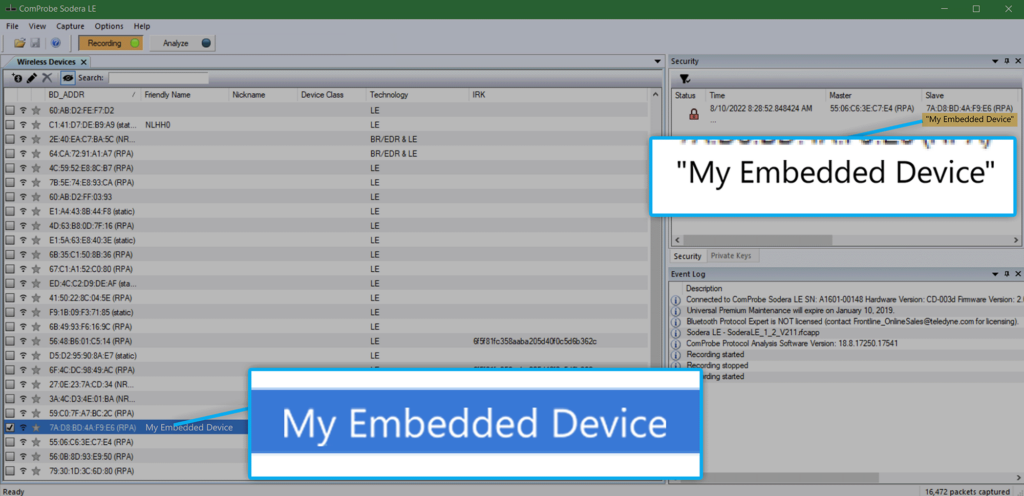
In the screenshot below, you can see the list of devices found by the Sodera LE. It’s helpful to remember here that, unlike the nRF Sniffer, the Sodera LE has hardware capabilities to listen to transmissions on all 3 BLE advertising channels simultaneously so we know we will catch every BLE transmission.
We can find our device listed among the found devices with the Friendly Name category especially helpful for making the identification. CPAS will also show previous devices captured even if they are not actively broadcasting BLE advertisements or other data.
CPAS expands on Wireshark’s functionality by giving users the ability to further analyze and filter down through packets. At this point in the demonstration, we will start the same pairing process as before after finding My Embedded Device in the Wireless Devices view.
Once our device is selected, the next usual step is to start the Analyzer function and navigate to CPAS’s frame display to see the captured frames. This view shows the decoded pairing process with the ability to filter through specific protocols and makes it easier to look for different types of behavior.
The gif below shows how we can filter through different BLE layers to see specific steps of the pairing process. Starting with advertisement packets, we can see our device advertising and receiving scan requests for more information from our Android phone.
Once the connection indication is sent, we can view the link layer frames to see feature requests. The SMP tab shows the security exchanges taking place during the pairing process (and we can tell at which point in the process this happens with the Frame#).
Finally, one of the more interesting things to point out is the ATT layer view which shows the higher layer BLE write and read interactions between the two devices.
Additional Features to Consider
The world of BLE analyzers is quite complex and there are many different debug problems or analyzer features outside of this blog post that an analyzer user would find helpful. A few especially cool features of the Sodera LE are its ability to allow users to identify devices that have changed addresses, track and visualize packet throughput of multiple devices, and visualize BLE interactions through message sequence diagrams. These features do not fit within the scope of this blog post so we’ve included three short examples below to give you an idea of what the features look like and how they might be used.
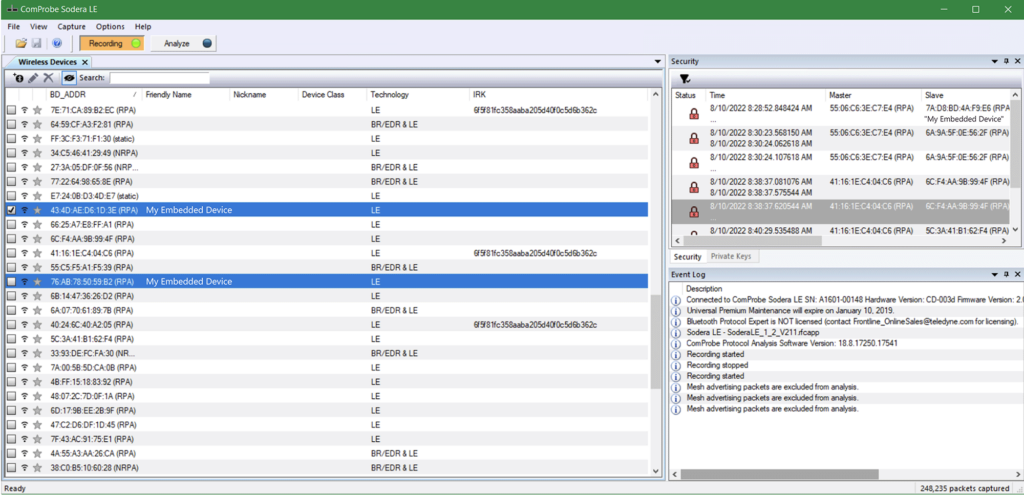
CPAS and the Sodera LE allow us to easily see when a device’s address has changed. A device’s MAC address may rotate if using something like Random Static and/or Random Private Resolvable addressing for strong security among bonded devices.
The image below shows the same device as identified by the Friendly Name but with two different entries in CPAS under a different address. CPAS’s ability to show previously broadcasted devices can help you identify when the address has switched and allows you to analyze packets under the new address.
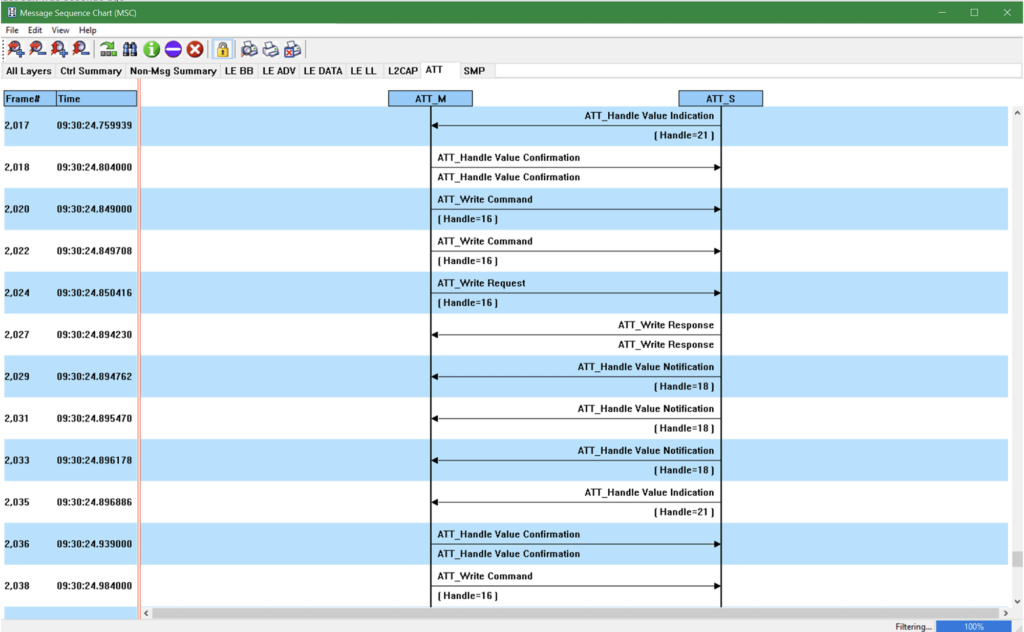
CPAS includes a Message Sequence Chart which is a series of diagrams that allow you to easily visualize the sequence and order of packets exchanged between two devices. This can be especially useful when the list view in Frames Display is hard to follow or full of packets in a busy exchange.
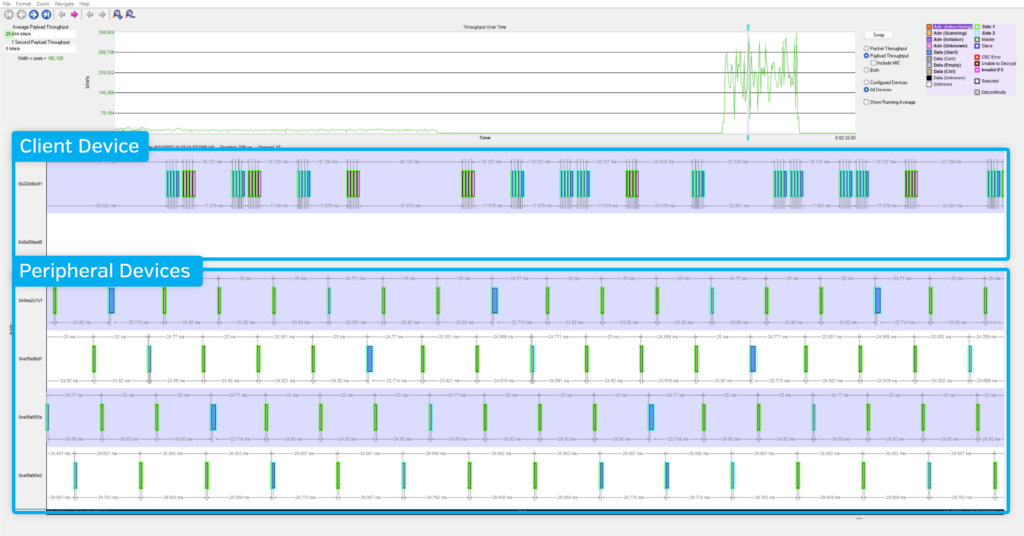
A very cool feature unique to multichannel, simultaneous-capture analyzers is the ability to track packet throughput of multiple devices. Situations like exchanges between multiple peripherals and one client can be especially pertinent to the throughput analysis. If you need to verify throughput limits or identify bugs bogging down throughput, this tool can help keep track of which devices are causing lost or delayed packet transfers. In addition to analysis using the visualization and statistics on CPAS, you can also inspect throughput with custom scripts that utilize the captured packets from the Sodera LE.
Choosing the Right BLE Sniffer for Your Needs
BLE analyzers provide meaningful value during development and debugging. Their ability to capture traffic and analyze it over time makes them powerful tools for uncovering difficult-to-find issues. While high-end analyzers offer far more functionality and visibility than entry-level options, they also come with tradeoffs—namely higher costs, more complex setups, and steeper learning curves.
Fortunately, it’s easy to get started with a low-end analyzer. These tools are often enough for basic visibility and quick checks. If you’re not seeing the data you need or can’t isolate the problem, that’s often the signal it’s time to step up to a more advanced tool. This is the same progression our engineers follow: starting with a lightweight tool like LightBlue and moving to something like the Sodera LE as complexity increases.