
For those of us writing Android apps for a living, Android Studio is our bread and butter. Optimizing Android Studio will make your development experience both enjoyable and productive. In this blog post, I will share some tips to improve build speed, increase available RAM to the IDE, and some visual enhancements to boost productivity on Android Studio. Let’s get started!
Gain Insight into Your Builds
Writing an Android app often involves building the project many times a day. Small delays can add up and result in significant wastage just trying to build a project. This is particularly true for large projects.
A neat way to inspect your builds and identify performance bottlenecks is to generate build scans. Build scans are shareable records that provide very detailed information about what happened during the build process, and allow us to see how much time different build tasks took.
With Gradle 4.3+, you can easily create a build scan by using the –scan command line option.
For example, you can use this command to install your app to a connected device from the command-line and generate a build scan:
./gradlew installDebug --scan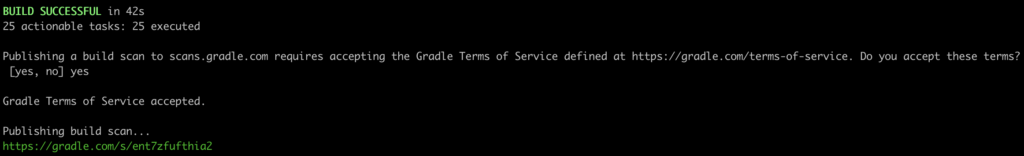
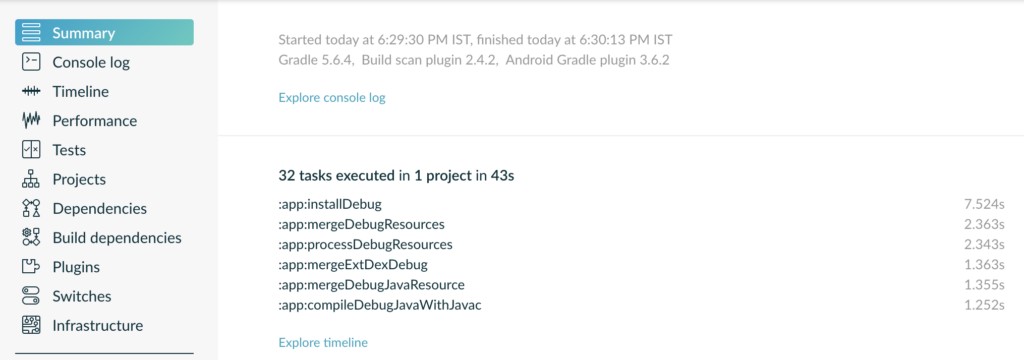
You can open the generated link to view details about the generated build:
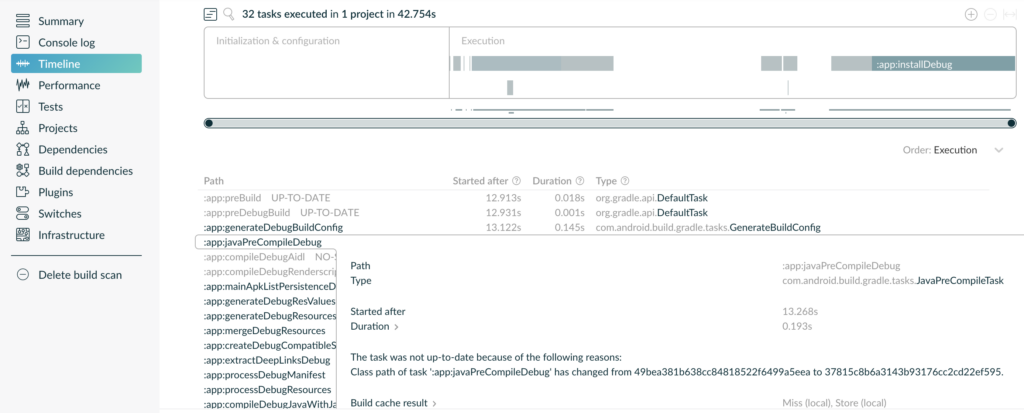
You can open the “Timeline” tab to see a visual timeline of task execution which can help you identify possible bottlenecks.
Improve Build Speed
- The easiest improvement that can be made is to keep Gradle up to date. New versions of Gradle often contain performance optimizations. Since new Gradle versions are backward compatible, this is a low risk improvement.
- The official Gradle performance improvement suggestions recommend parallelizing builds, enable build caching, and other enhancements. I’ve added the following to my global Gradle config file (~/.gradle/gradle.properties):
org.gradle.parallel=true
android.enableBuildCache=true
org.gradle.caching=true- org.gradle.parallel=true: This executes tasks in parallel as long as those tasks are in different projects.
- android.enableBuildCache=true and org.gradle.caching=true: This stores task outputs in a build cache and reuses them when the task is executed with the same inputs. This reduces build times when switching branches.
The official Android documentation on build optimization contains many more useful tips on profiling builds. It is worth checking out if you want to squeeze every ounce of performance – https://developer.android.com/studio/build/optimize-your-build.
Memory Allocation Tweaks
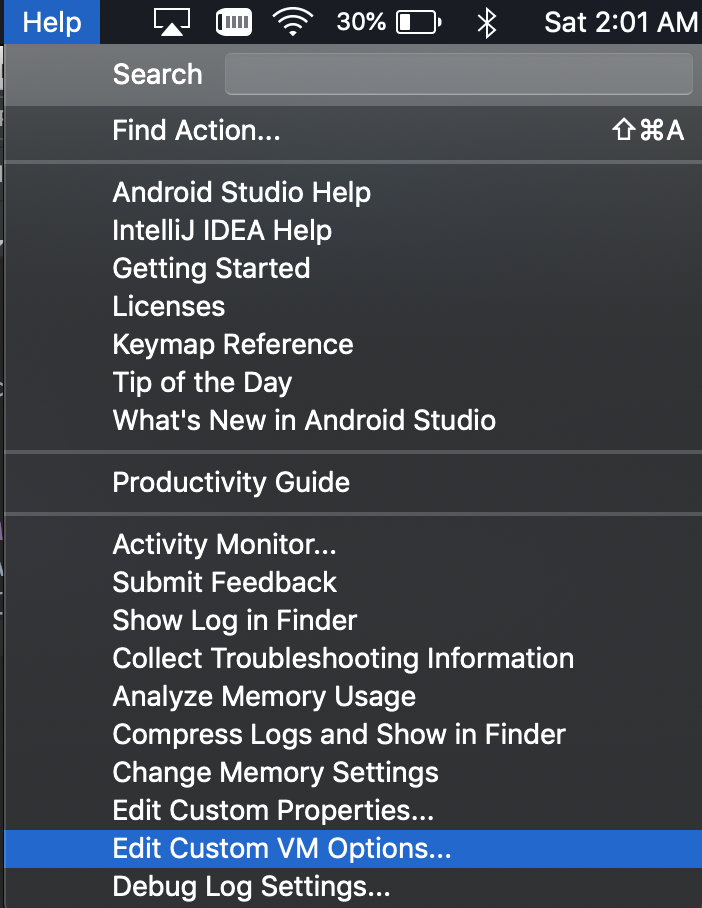
The default memory allocation for Android Studio is too small for work on any serious project. This issue is compounded when opening multiple instances of Android Studio. To increase the memory allocation, go to Help > Edit Custom VM Options.
The default values of Xmx and XX are:
-Xmx1280m
-XX:ReservedCodeCacheSize=240m
Depending on your available RAM, these values could be increased to get better performance out of Android Studio. Xmx specifies the maximum size of the memory allocation pool for JVM. For a PC with 8GB of RAM, -Xmx2G is a good value to start. It’s advisable not to exceed half the maximum size of your system’s RAM size when allocating heap size. I set Xx to 512m.
Show Available RAM
After increasing RAM allocation, you can also monitor RAM usage in real-time inside Android Studio!
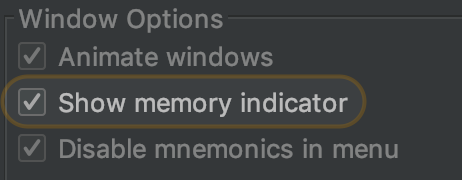
Go to Preferences > Appearance & Behavior > Appearance.
In Window Options section, enable Show memory indicator:
You can now see the available RAM on the bottom right corner of Android Studio:
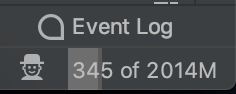
You can also tap on the display to clear the heap!
Visual Enhancements
IDE Theme and Font Preferences
Ok, I know this is more of a preference, but I hate the Default Light theme on Android Studio. It strains my eyes. I’d recommend switching to the Darcula theme (or even better, the Monokai dark theme!) I’d also recommend using the hipster open source JetBrains Mono font.
Change Logcat Colors
By default, Logcat uses only two colors for six different kinds of log messages (Assert, Debug, Error, Info, Verbose, and Warning). This makes it very difficult to differentiate between the other log levels that are all printed in black or white. I used to make all important log messages of the Error type (even if they were not errors) just to make them more readable on Logcat. Thankfully, customizing Logcat message colors is a breeze!
To customize Logcat, go into Preferences > Editor > Color Scheme > Android Logcat. To modify a color, you need to uncheck “Inherit values from” and then tap on the Foreground color to show the color picker tool.
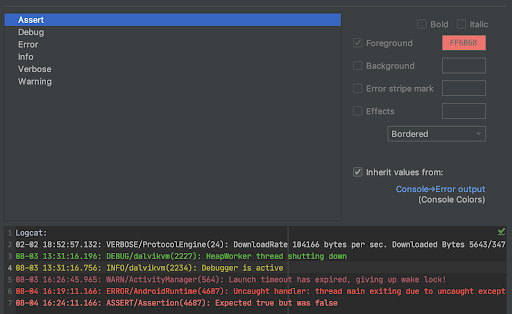
Here are the colors that I use:
Debug: #33BB2E
Error: #FF413f
Info: #BBB514
Warning: #BB5462
Conclusion
In this blog post, we covered some of our favorite Android Studio customizations. However, there are a ton of other options available in Android Studio, and we just scratched the surface. I would encourage you to play around with the configurations and learn about the IDE as much as possible. I believe taking the time to understand your IDE is as vital as coding. Do you have any favorite customizations? We’d love to hear!